
Following on from our article entitled «The shortcomings and dirty secrets of ETFs and index funds«, in which we explained that not all that glitters is gold when it comes to passive management – which is so fashionable these days – we’re going to summarise and discuss the an interesting study carried out by Alexey Panchekha, CFA, on the blog CFA Institute’s Enterprising Investor. In this study, this specialist and researcher in mathematical applications for risk management – who has worked for Goldman Sachs and Bloomberg, amongst others – explains what he has termed the The Active Manager’s Paradox. Let’s see what he is referring to and how the findings of his study might be useful to the average investor.
.
The million-dollar question is: Is the reason why active management has lost ground to passive management over the last decade down to the high fees they charge, the fund managers’ lack of skill, or some other factor?
.
What is needed to answer this question rigorously is not a thoughtless, speculative or emotionally charged response from fans of one management style or another. That is why this study is based on facts regarding the decisions made by active fund managers. As the saying goes, you can hardly manage what you cannot measure.
.
Panchekha has analysed how active managers generate alpha with their selection of companies. They have carried out a multi-year study covering 114 US investment funds belonging to 57 different fund families, and have evaluated more than 400,000 one-year periods of returns (details of the methodology used in the study can be found at the end of this article). Taken together, the study’s sample represents 2 trillion (US trillions) in assets under management.
.
The key lies in the managers’ level of conviction. In other words, the level of certainty that fund managers have regarding each sub-group of companies in their portfolios. To determine this, the study distinguishes between overweight and underweight positions rather than simply the absolute volume, which could be distorted by the mandatory weightings in their respective benchmarks. The study therefore distinguishes between three types of shares in portfolios:
- Those with a higher weighting or where there is greater conviction
- Those that are underweighted or where conviction is lower
- The neutrals
The components of these three categories are identified by measuring their portfolios and weightings on a daily basis, with each group being rebalanced every 14 days. The data was obtained from the Hercules database, provided by Turing Technology Associates. The results, shown in the chart below, illustrate the success rate of each category compared with its respective benchmark indices over successive one-year periods, as well as the annual alphas achieved during those periods.
The Impact of High-Conviction Overweights, Excluding Fees

The Impact of High-Conviction Overweights, Net of 85 basis points’ Fees

As can be clearly seen, overweight or high-conviction positions – comprising the fund managers’ best ideas – are the only category that actually generates alpha in excess of the indices. In 84% of cases when looking at gross returns, and in 74% of them when considering net returns with an average of 85 basis points in fees paid. By comparison, both underweight (lower-conviction) and neutral positions generated a gross success rate of 50% (pure beta), which would fall below that threshold after paying those same fees.
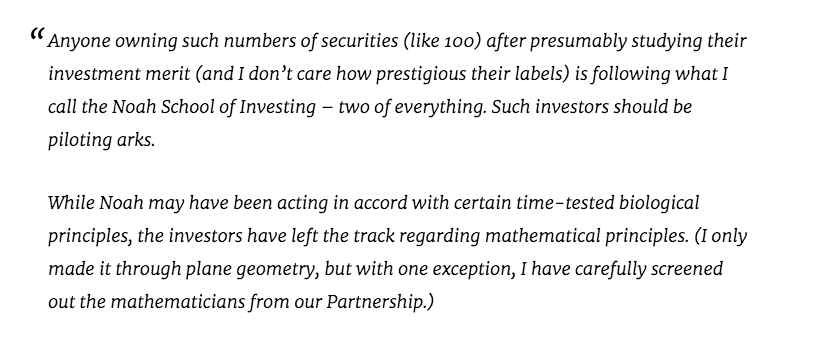
Warren Buffett, Letter to Shareholders, 1966.
.
High-conviction overweight positions – that is, those in which fund managers have the greatest confidence and certainty – are the only parts of their portfolios that generate returns in excess of their benchmark indices. Therein lies the paradox: although active fund managers demonstrate an ability to outperform the indices when selecting their preferred shares, they lose that ability when designing the rest of their portfolios in their eagerness to round them off, diversify them, balance them or reduce their «risk», once again confusing risk with volatility. In some cases, it is a lack of courage, a lack of conviction, or simply that many of them have their hands tied by the ratios and indices which, according to their prospectuses, they are required to follow in a certain way. The reason doesn’t matter. What the study shows is that only overweight holdings and those with high conviction manage to outperform the market. Any other asset allocation will reduce returns.
.
But that’s not all. Furthermore, according to the study, the average fund manager self-sabotages their returns by reducing their high-conviction positions to a meagre 55% of their portfolios. The corresponding allocation to underweight and neutral assets, accounting for almost half of their portfolios, therefore amounts to a beta ballast unbeatable. To illustrate this, Panchekha gives an example from American football, but the equivalent here would be as if the Barça manager only fielded Messi for 55% of the 90 minutes of play.
.
The result of this combination of a lack of conviction (in the quality of their analysis) on the part of active fund managers, their lack of courage to set themselves apart from other fund managers, and the regulatory and corporate constraints they face, leads them to manage «risk» in a way that is – paradoxically – risky which causes them to lose everything they have gained and more. The following graph illustrates the harsh reality, Most active fund managers do not deserve the fees that investors pay them to outperform the market, since almost half of their portfolios fail to do so, and the costs do the rest. The problem is that the statistics do not distinguish between diversified and concentrated portfolios. In other words, portfolios in which 90 or 100% of the shares are high-conviction picks, compared with portfolios where, according to the statistics, only 55% of the shares are high-conviction picks.
Actively Managed Large-Cap Mixed-Asset Mutual Funds vs. the S&P 500

Whilst it is common practice in the financial industry to blame high fees for the poor performance of most actively managed funds, Panchekha’s study reveals that fees are only a secondary factor. In other words, Diluting the sole source of alpha in portfolios to levels of 55% has a far more devastating effect on returns than the fees paid. Returning to the football analogy, whilst Barça fans are blaming the team’s mediocre form on the exorbitant bonuses the manager receives (or on the condition of the pitches, or the weather, or injuries, or the referees, etc.), they should instead be criticising him for systematically leaving Messi on the bench for almost half of the matches. Panchekha states, and I quote:
«Whilst it is standard practice in the industry to attribute these outcomes to higher fees, our research suggests that fees are only a secondary factor. Diluting the sole source of stock-selection alpha to a minority component of a portfolio has a far greater structural impact than higher fees.»
The now legendary underperformance of most actively managed investment funds relative to their benchmark indices has led US investors to withdraw $1.3 trillion (US trillions) from these funds and invest it in the growing passive fund and ETF sector, according to data from Morningstar.
.
The study presents averages and samples of funds without distinguishing between concentrated and diversified portfolio managers. If we separate the wheat from the chaff, that is to say, if we select managers of small portfolios, composed entirely of shares in which they have a very high degree of certainty and conviction, we will find a great deal of alpha and very little drawdown, despite their fees which, as we mentioned in the previous article, tend to be quite high. The NET returns of these star-manager funds, with boldly concentrated portfolios and an in-depth understanding of the businesses in which they invest, clearly and consistently outperform their respective benchmark indices over time, regardless of their TER. Or does any Berkshire Hathaway shareholder really care about Buffett’s salary or that of any of its current executives? And if, at any point, the returns on that holding company were to decline alarmingly, shareholders should be looking more closely at whether its management is beginning to compromise the quality of the holding company – for the first time in decades – rather than at whether Buffett or his successors are receiving high or low salaries.
.
For the sceptics and others groupies When it comes to passive funds and ETFs, the study carried out by Panchekha should be the litmus test: The main reason for the mediocrity of active fund managers is their limited ability and/or lack of courage to concentrate their portfolios 100% on their «best ideas» or high-conviction companies. And this is, after all, an open secret that the world’s best value investors have always proclaimed: Why would you invest in your twentieth-best idea when you can invest in your first, second and third? The only answer is a lack of conviction, a fear of making a mistake, or corporate or regulatory obligations. High management fees are merely the final nail in the coffin for portfolios that are overly diversified and lack conviction and quality. How else could one explain the fact that active funds with the best NET returns on the planet (many of which are already closed to new investors) have fees significantly higher than the average of 85 basis points cited in the study? Let’s look at some examples of spectacular alphas in terms of NET returns in US dollars over the last few decades, the first against the MSCI China Index, the second against the Russian RTS Index and the third against the S&P 500 itself:
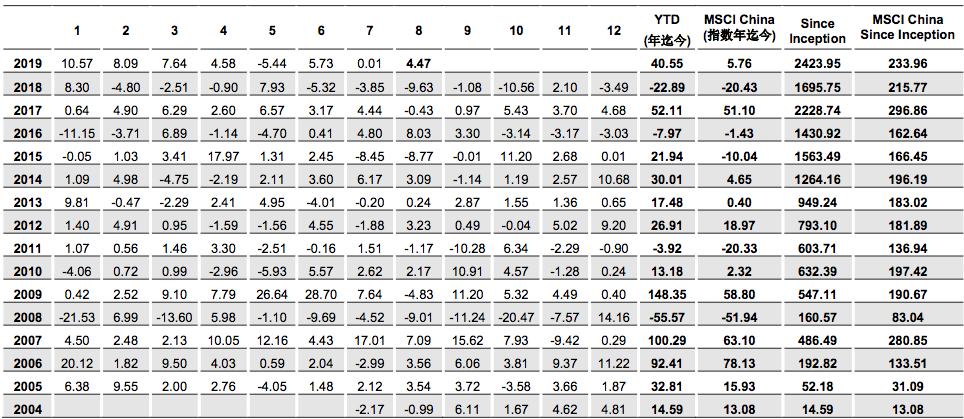
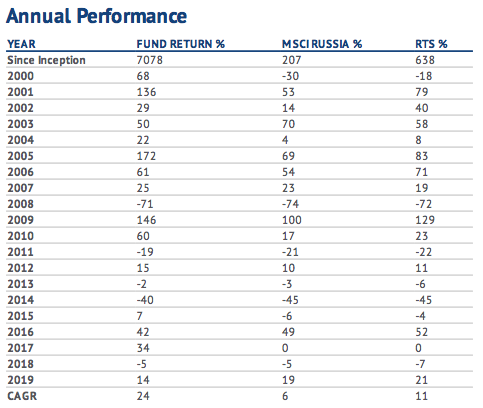
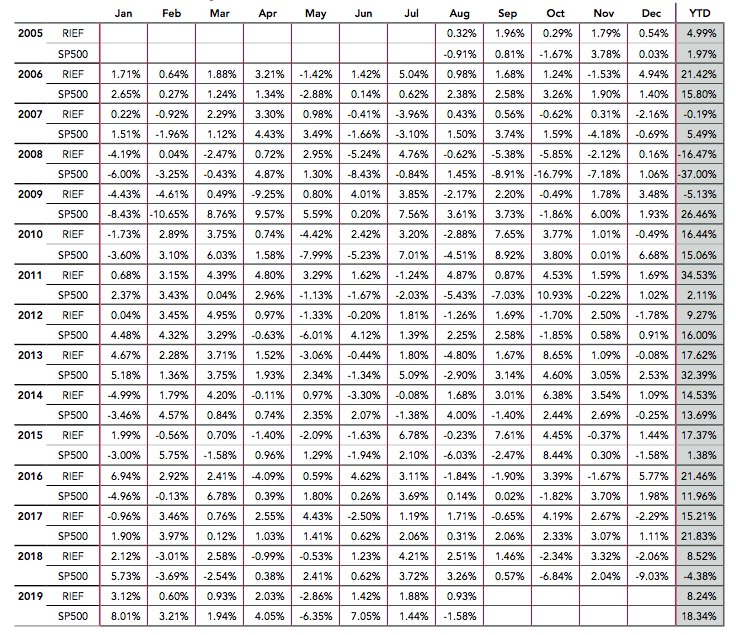
Finding funds that overcome the Active Manager’s Paradox is key for investors. But it is also crucial for the active fund industry that more and more managers overcome their fear of standing out from their competitors, that they overcome the self-imposed limitations in their prospectuses, and that they stop viewing concentration and volatility as risk factors. The real risk faced by most active managers who are content merely with not being the worst in their class is that they will eventually become extinct. And their extinction, whilst well-deserved, will increasingly favour the growth of index funds with portfolios that select companies in a far simpler and more superficial manner. Passive funds that behave as if a flat buyer were to decide to go to the solicitor simply by taking a few superficial ratios into account, without fully understanding the property’s condition, its energy efficiency, its building specifications or the neighbourhood, to give just a few examples. Obviously, it is better to buy a flat by taking a few superficial ratios into account than simply buying on a friend’s recommendation or at random, of course. But that is not the way in which our investments will perform adequately in the long term.
.
In short, the good news is that active fund managers as a whole create value. The bad news is that the vast majority of them lose it before it reaches their investors. Investors therefore have two options: To do sufficient research to be able to identify the fund managers with the greatest conviction and concentration in their portfolios; or simply to blame the mediocre performance of active fund managers on the fees paid, and throw themselves into the arms of even more diversified portfolios with less conviction but with low-cost fees. For those who choose to select the active funds they feel most strongly about for their portfolios, it is almost essential that expand their investment universe to include 100% of the world’s existing funds and don’t just settle for the 10% model sold in Spain.
.
Below are the details of the study’s methodology:
Research Design and Methodology
This analysis is based on a proprietary database of daily fund positions and portfolio weights compiled and maintained by Turing Technology Associates Inc. The specific funds included in the research dataset comprise 114 unique US equity mutual funds, from 57 fund families, representing $1.996 trillion in assets under management (AUM).
Fund Selection Process
The funds selected for use in the research were drawn from the set of mutual funds included within a series of investment portfolios known as Ensemble Active Management (EAM) Portfolios. Turing licences a series of proprietary technologies to clients to support their creation of such EAM Portfolios. Each EAM Portfolio is typically constructed from a set of 10 to 15 underlying mutual funds with a corresponding industry benchmark. As of early August 2019, Turing had 24 client-designed EAM Portfolios in live production.
All 114 funds used in the study were selected by Turing’s clients or prospective clients in connection with the design of an EAM portfolio. As Turing’s clients selected the underlying funds and the corresponding benchmark, the fund selection process remained independent of the researchers.
Each pair of a fund and a benchmark is the subject of the analysis. The benchmarks included the S&P 500, Russell 1000, Russell 2000, Russell 1000 Value and Russell 1000 Growth. The time periods used were either January 2014 to July 2019, or January 2016 to July 2019, depending on the data available.
Source of Daily Fund Positions
To access daily fund holdings, Turing applied its proprietary fund-replication technology known as the Hercules System. Hercules is a machine learning-based platform that processes a vast amount of publicly available data, with the core concepts behind the approach having been in use and under development for more than a decade. Hercules is not a regression-based approach. Daily estimated positions are generated by the Hercules System, with the out-of-sample portfolios rebalanced every 14 days.
For reference, the Hercules estimates of fund holdings and weights for the funds used in this study typically generated a tracking error of less than 1%, and a correlation with actual fund returns of more than 99.7%.
Isolating the Manager’s Conviction
The aim of this research was to analyse the impact of manager's conviction in security selection, and so we incorporated two key design elements into the study. Firstly, securities were categorised and evaluated on the basis of their portfolio weights relative to the benchmark. Rather than focusing on actual portfolio weights – which are heavily influenced by benchmark weights – the emphasis was placed on a manager’s decisions to overweight or underweight securities and the scale of those overweight or underweight positions. Second, we divided each fund into multiple, non-overlapping sub-portfolios determined by the level of manager conviction involved, and evaluated their performance separately. Each sub-portfolio was rebalanced every 14 days and treated as a distinct model portfolio. The three sub-portfolios analysed were:
- High-Conviction Overweights: A sub-portfolio comprising the fund’s largest overweight positions in equities. The sub-portfolio was selected to cumulatively represent 80% of the portfolio’s aggregate overweight positions relative to the benchmark.
- Underweights: A sub-portfolio comprising the fund’s largest underweight positions in shares. The sub-portfolio was selected to cumulatively represent 80% of the portfolio’s aggregate underweights relative to the benchmark.
- Neutral Weights: A sub-portfolio comprising overweight securities that are not included in the Overweight sub-portfolio and underweight positions that are not included in the Underweight sub-portfolio.
All sub-portfolios reflect distinct choices made by a fund manager. The dynamic portfolio weights for each sub-portfolio are proportional to the original fund weights, normalised to 100%. Securities not included in the benchmark were excluded as they cannot be properly assessed against a benchmark. All performance data was calculated both gross of any fees and after factoring in a hypothetical 85 bps fee. Neither result reflected transaction costs.
The performance data presented consists of rolling one-year data (daily intervals), which was analysed to determine the percentage of rolling periods in which each sub-portfolio outperformed the corresponding benchmark (Success Rate), and the average excess (or negative) relative return.
A sub-portfolio comprising securities included in the benchmark but not held by the mutual fund (i.e., zero weights) was constructed and analysed. This fourth subgroup was not included in the research results because the only way to capture any potential alpha would be through a 100% short portfolio, which is not permitted in a traditional mutual fund. For reference, the Zero Weight portfolio underperformed the benchmark by 78 basis points, on average. Unfortunately, even a frictionless short portfolio of Zero Weight securities would not be able to generate enough returns to cover the fees of even a standard long-only mutual fund.